
Is gRPCs performance a myth?

Performance claims are a tricky thing.
You can only say something is fast when it is compared to another reference. Otherwise, it is just numbers with a unit. I would say it also applies when “high performance” is plastered front and center of the website.
My first thought was: “Against what?”
For a quick overview, here is the summary: If your service needs to handle a few hundred million requests per month, gRPC’s is great. As long as you are mindful that higher number of connections and compression will have an impact on the throughput.
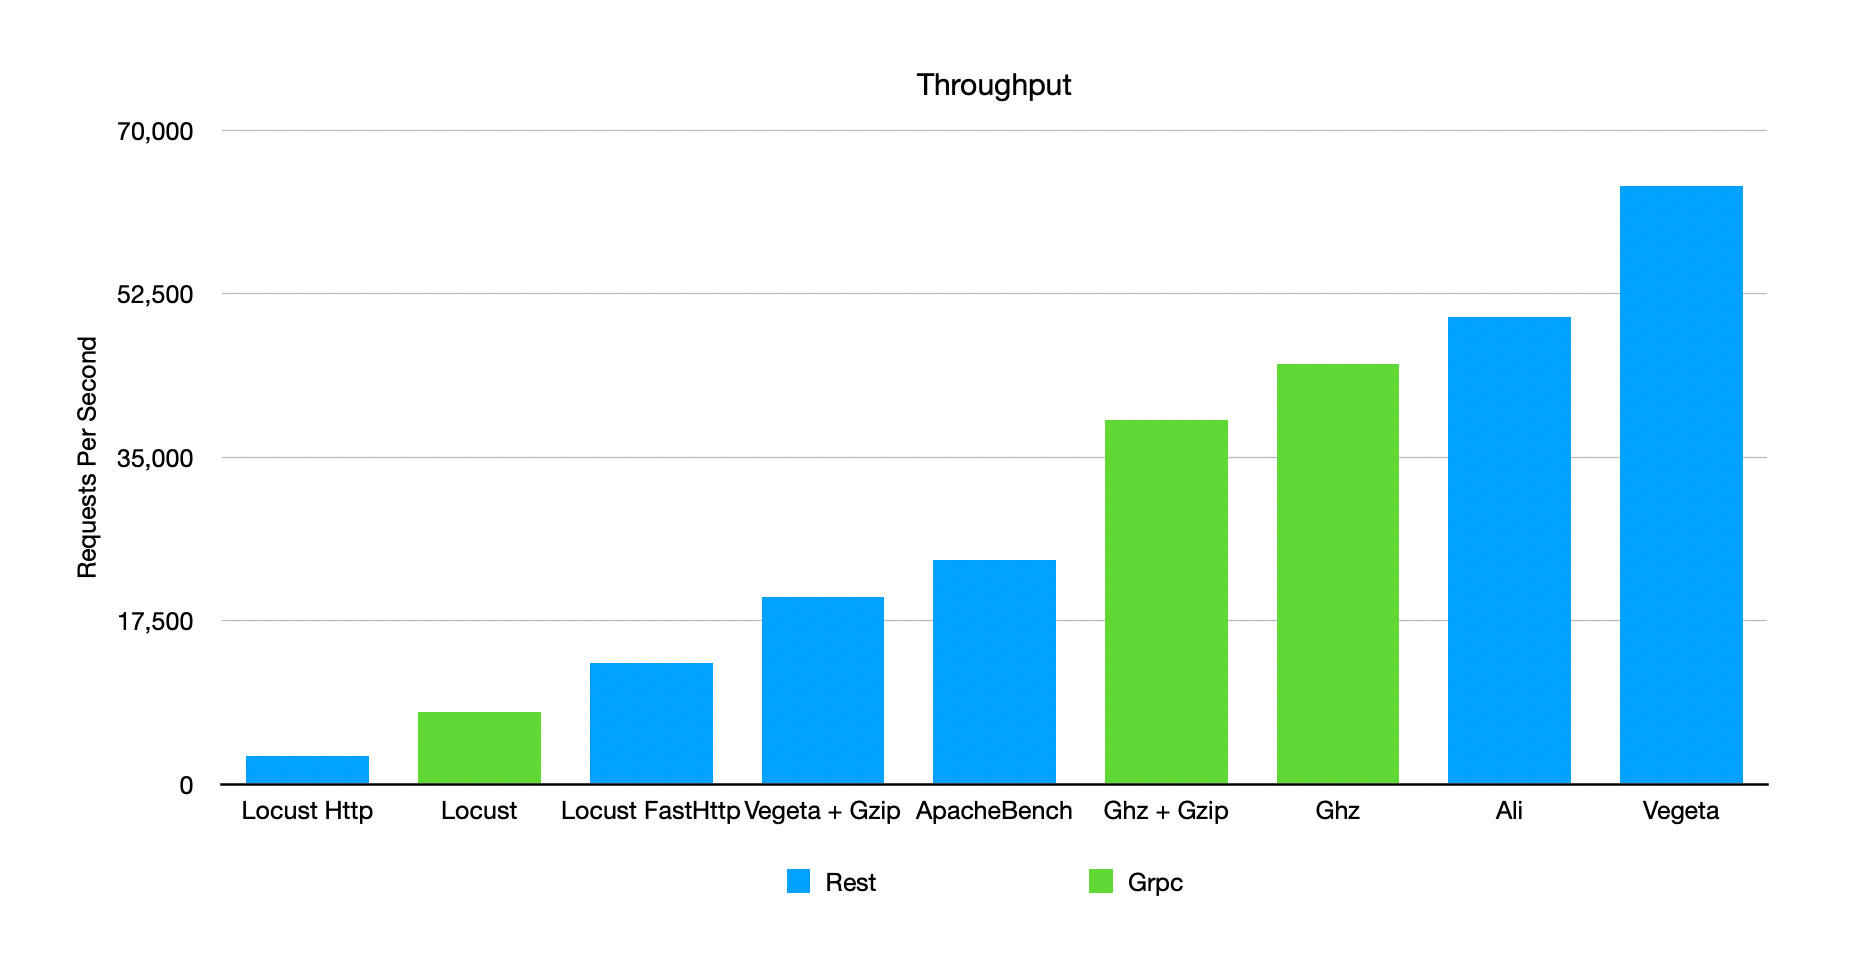
Here is a bar chart that shows the throughput between gRPC and REST API using different tools. Which also presents another point. Performance tests depend on the client implementation and not just the server.
Multi-tool of Madness
I started the whole process by deciding to compare gRPC with REST API implemented in C#. Since gRPC supports both unary and stream style APIs, I focused only on unary so that it would easier to compare against REST. This might not be optimal since streaming could be more performant, but that is an exercise for another day. And for the REST API, all the tests here are done against the minimal REST API because from my testing, there is minimal difference against the controller REST API. Finally, this is just an exploration to see if it is worth investing for a more detailed performance experiment with gRPC.
The setup is quite straightforward. Both gRPC and REST API will return data with a similar structure, which is a list of two student records that I asked ChatGPT to generate for me. There are no other dependencies or logic. Codes can be found at GitHub.
For the first round, I decided to use ghz for gRPC and apache bench for REST. I tried to keep the tests as equal as possible regardless of tools used, but that is not entirely possible. Some tools have more knobs to play with than others. For example, ghz can configure the number of CPU used or the total duration of tests, both of which are absent in apache bench.
For all the tests, I try to configure the following:
50 concurrent requests
10s duration, when parameter is available
use 10 CPUs, when parameter is available
In any case, here are the result for apache bench against the REST API
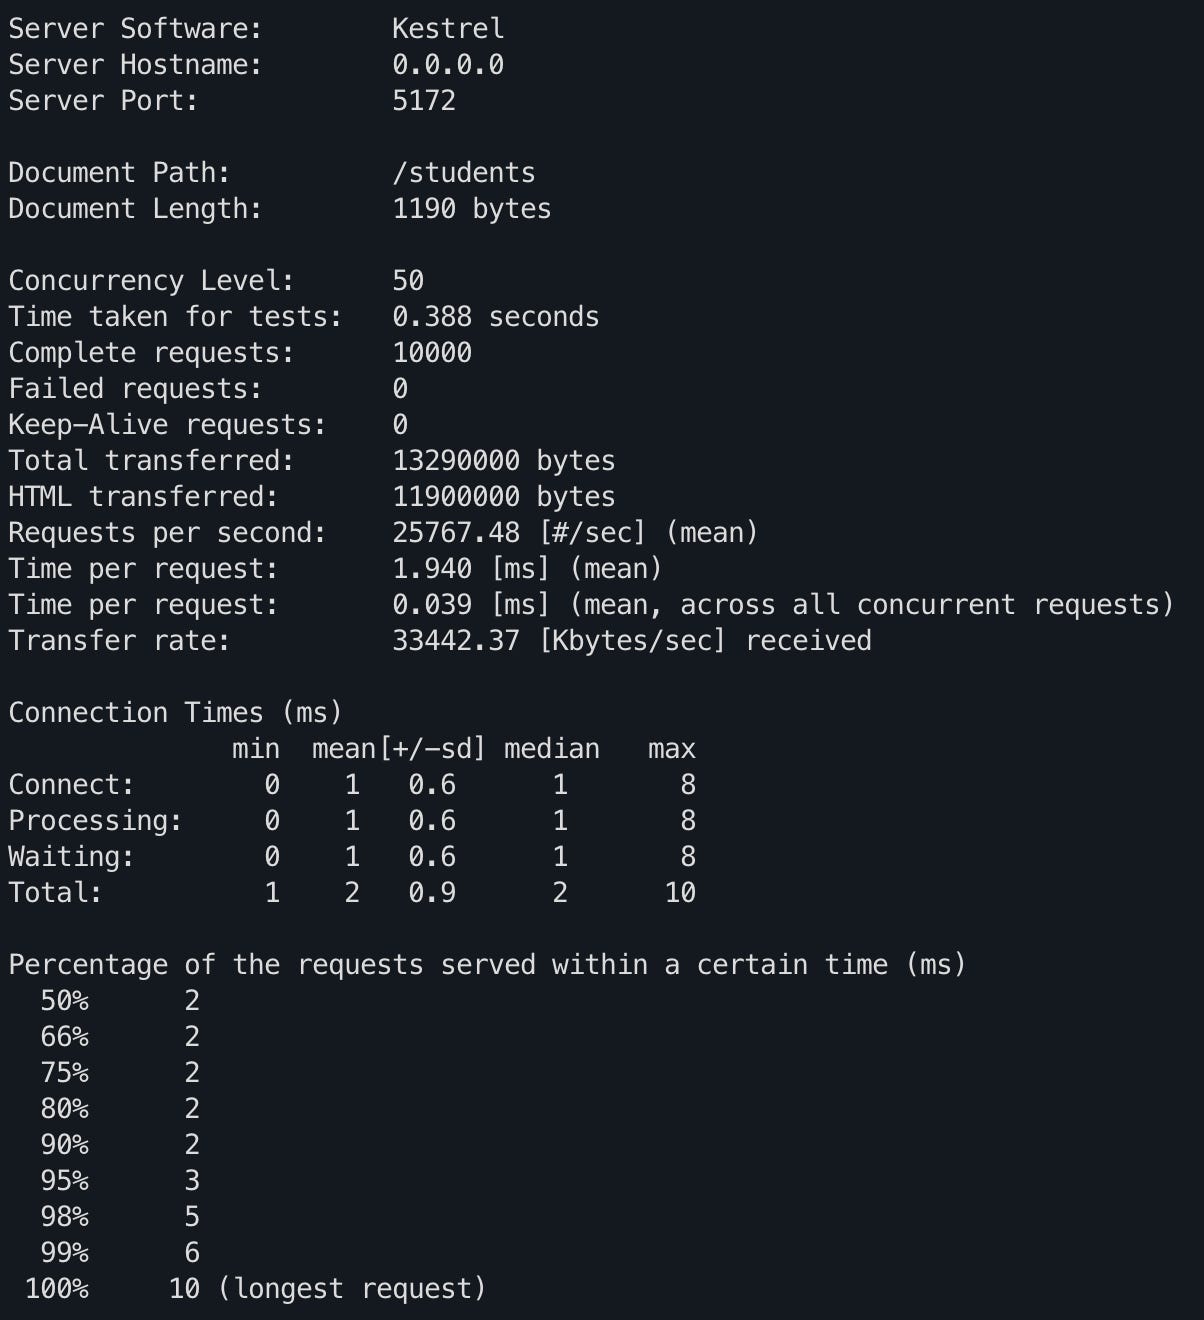
~20-24k requests per second (rps). It fluctuates like all the other tests.
99th lower than 6ms and 95th lower than 3ms.
What I find interesting is that ab opens 10k connections for 10k requests. I got from running this command.
watch -n 0.1 "netstat -an | grep 127.0.0.1.5172 | grep -c ESTABLISHED"I repeated the test using ghz against the gRPC API.
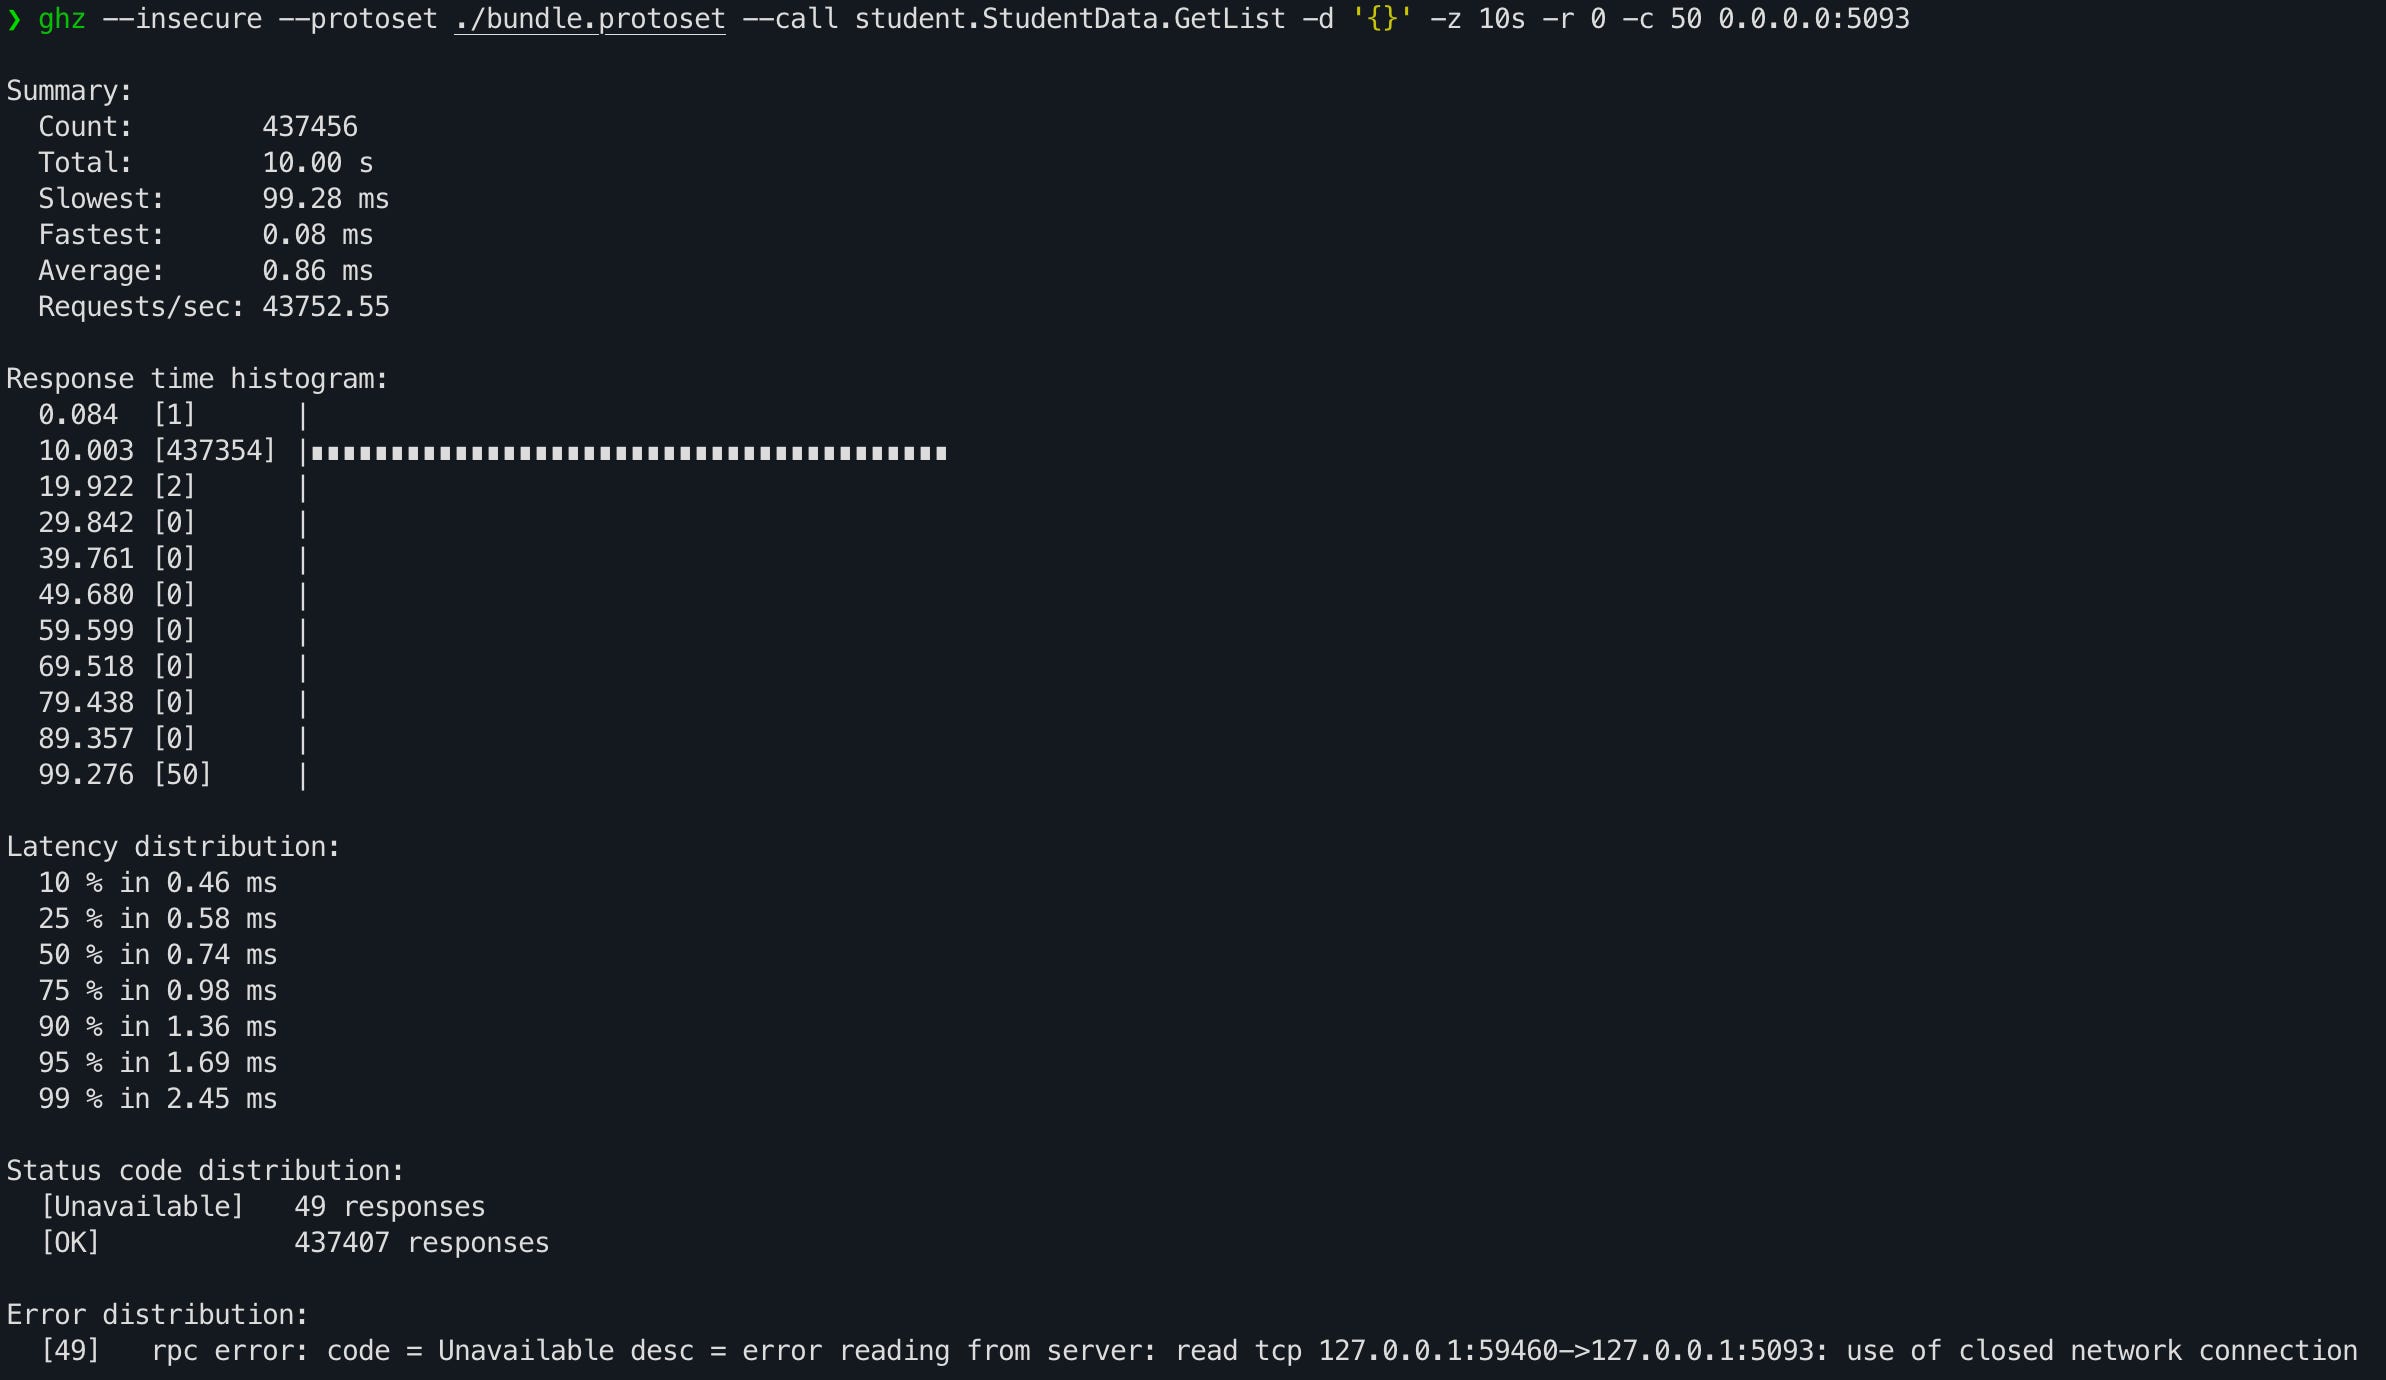
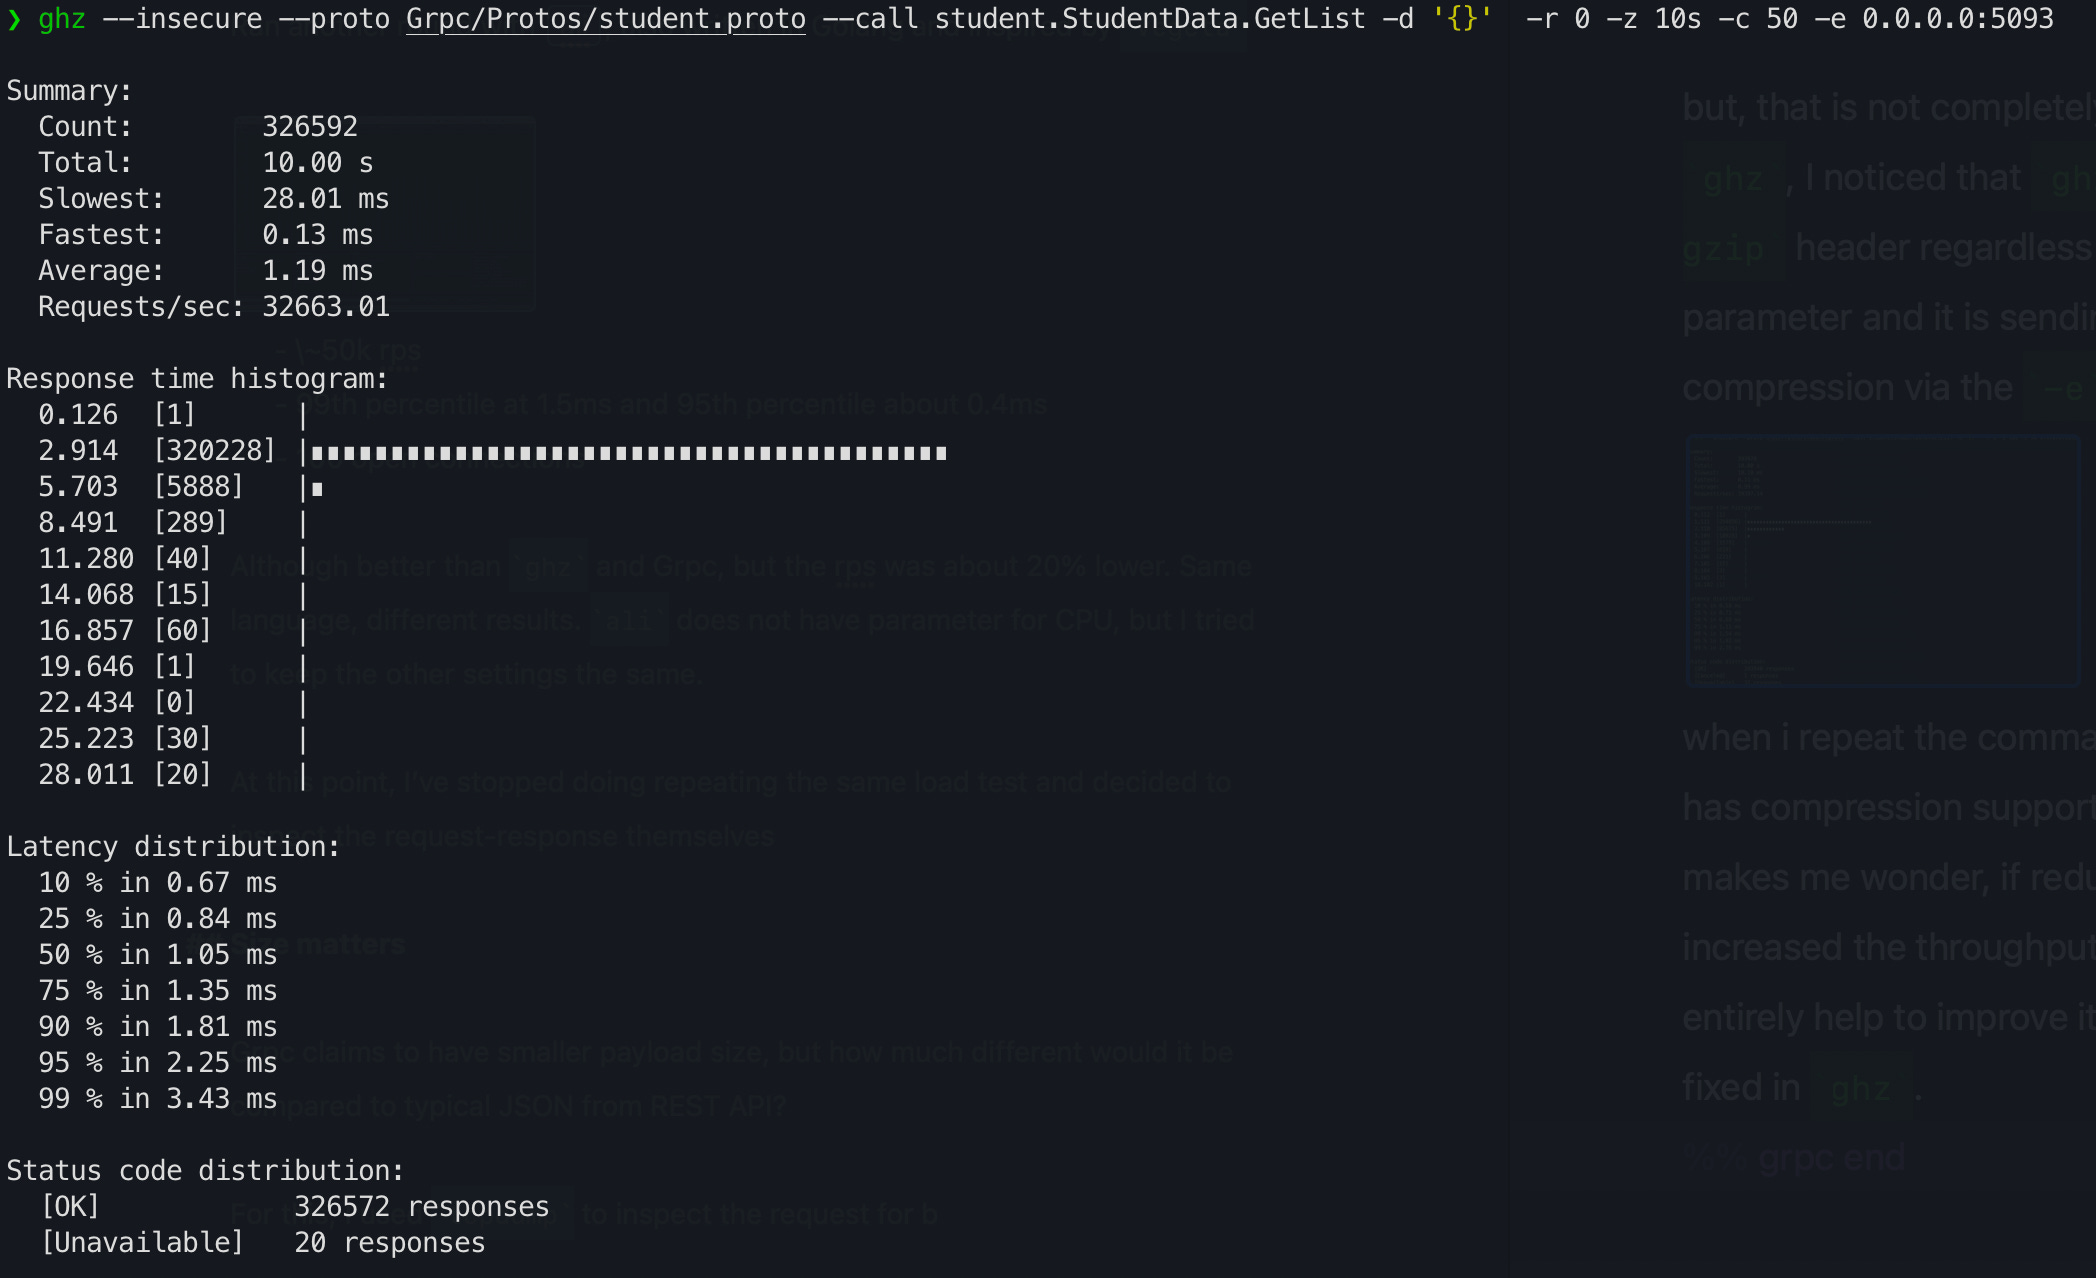
Initially, I ran the command with --proto and to see if there was a significant difference, ran it again with --protoset. But, both gave similar result which is:
~45k rps
99th percentile at 2.45ms and 95th percentile at 1.69ms. These values fluctuate.
I thought that was it, gRPC won, it is awesome, and I am going to spend the next 6 months advocating and switching all my APIs to it. But, there were a few things that bothered me:
abis an old tool. Old does not mean bad, but it has fewer parameters to adjust. Is it possible that it does not take advantage of multiple CPUs available for making the requests?Both
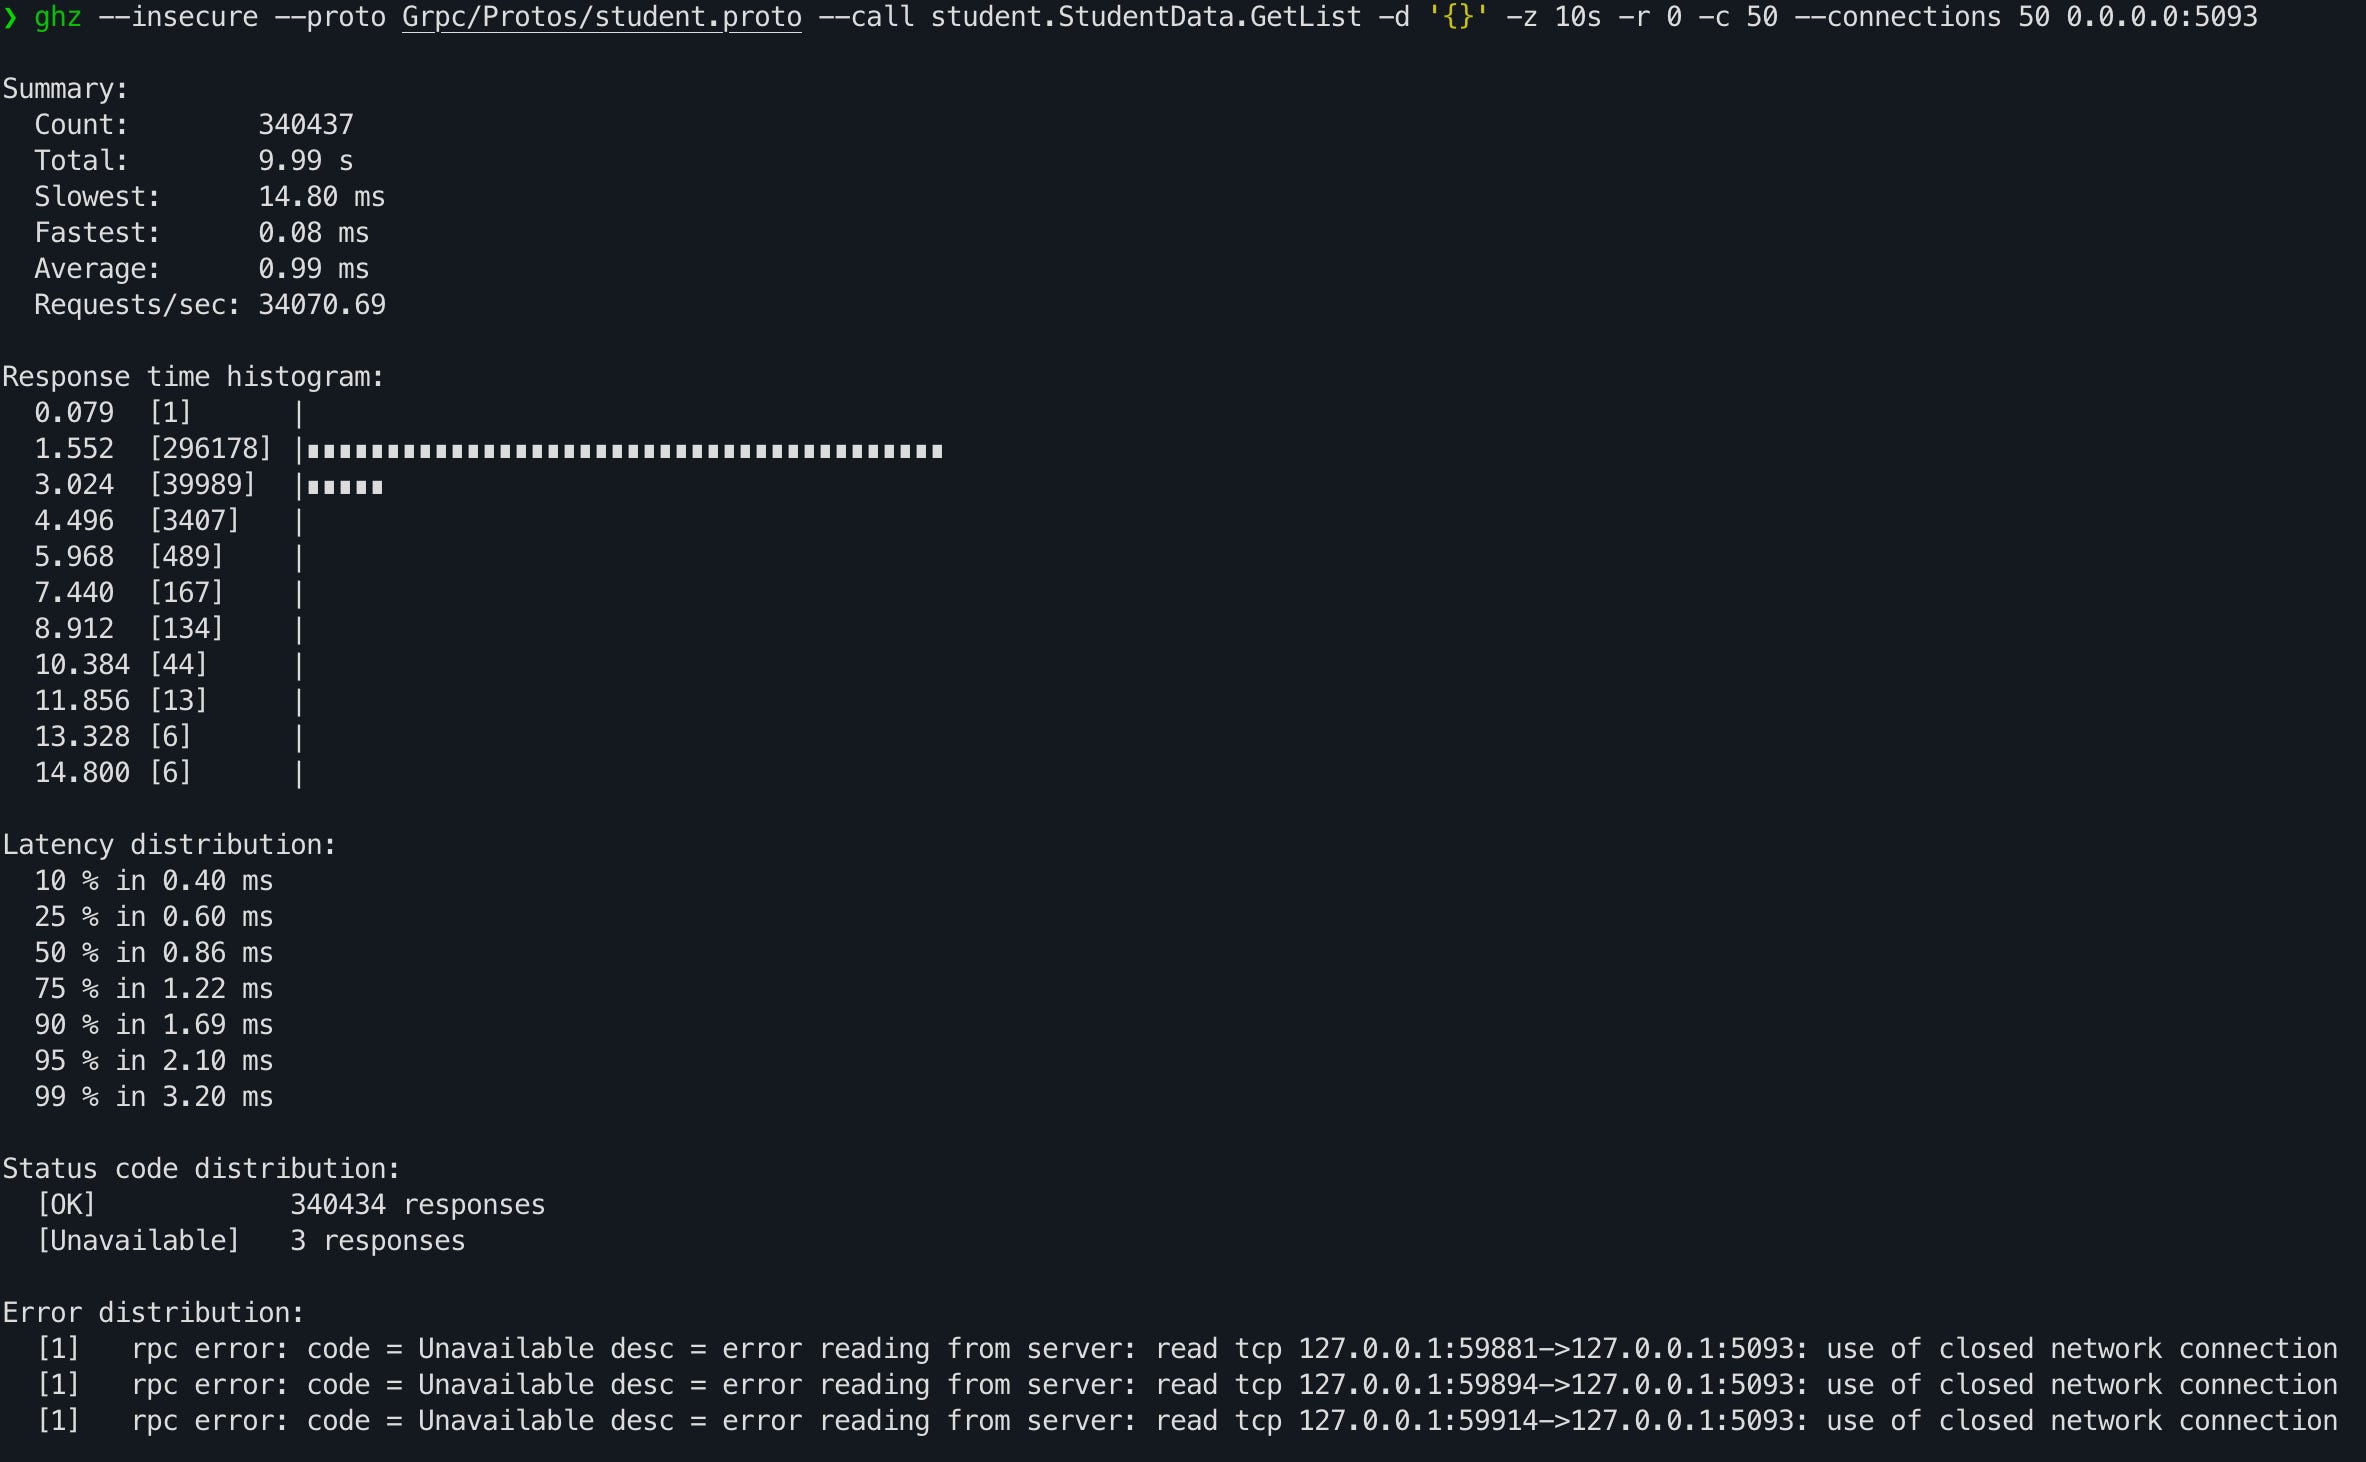
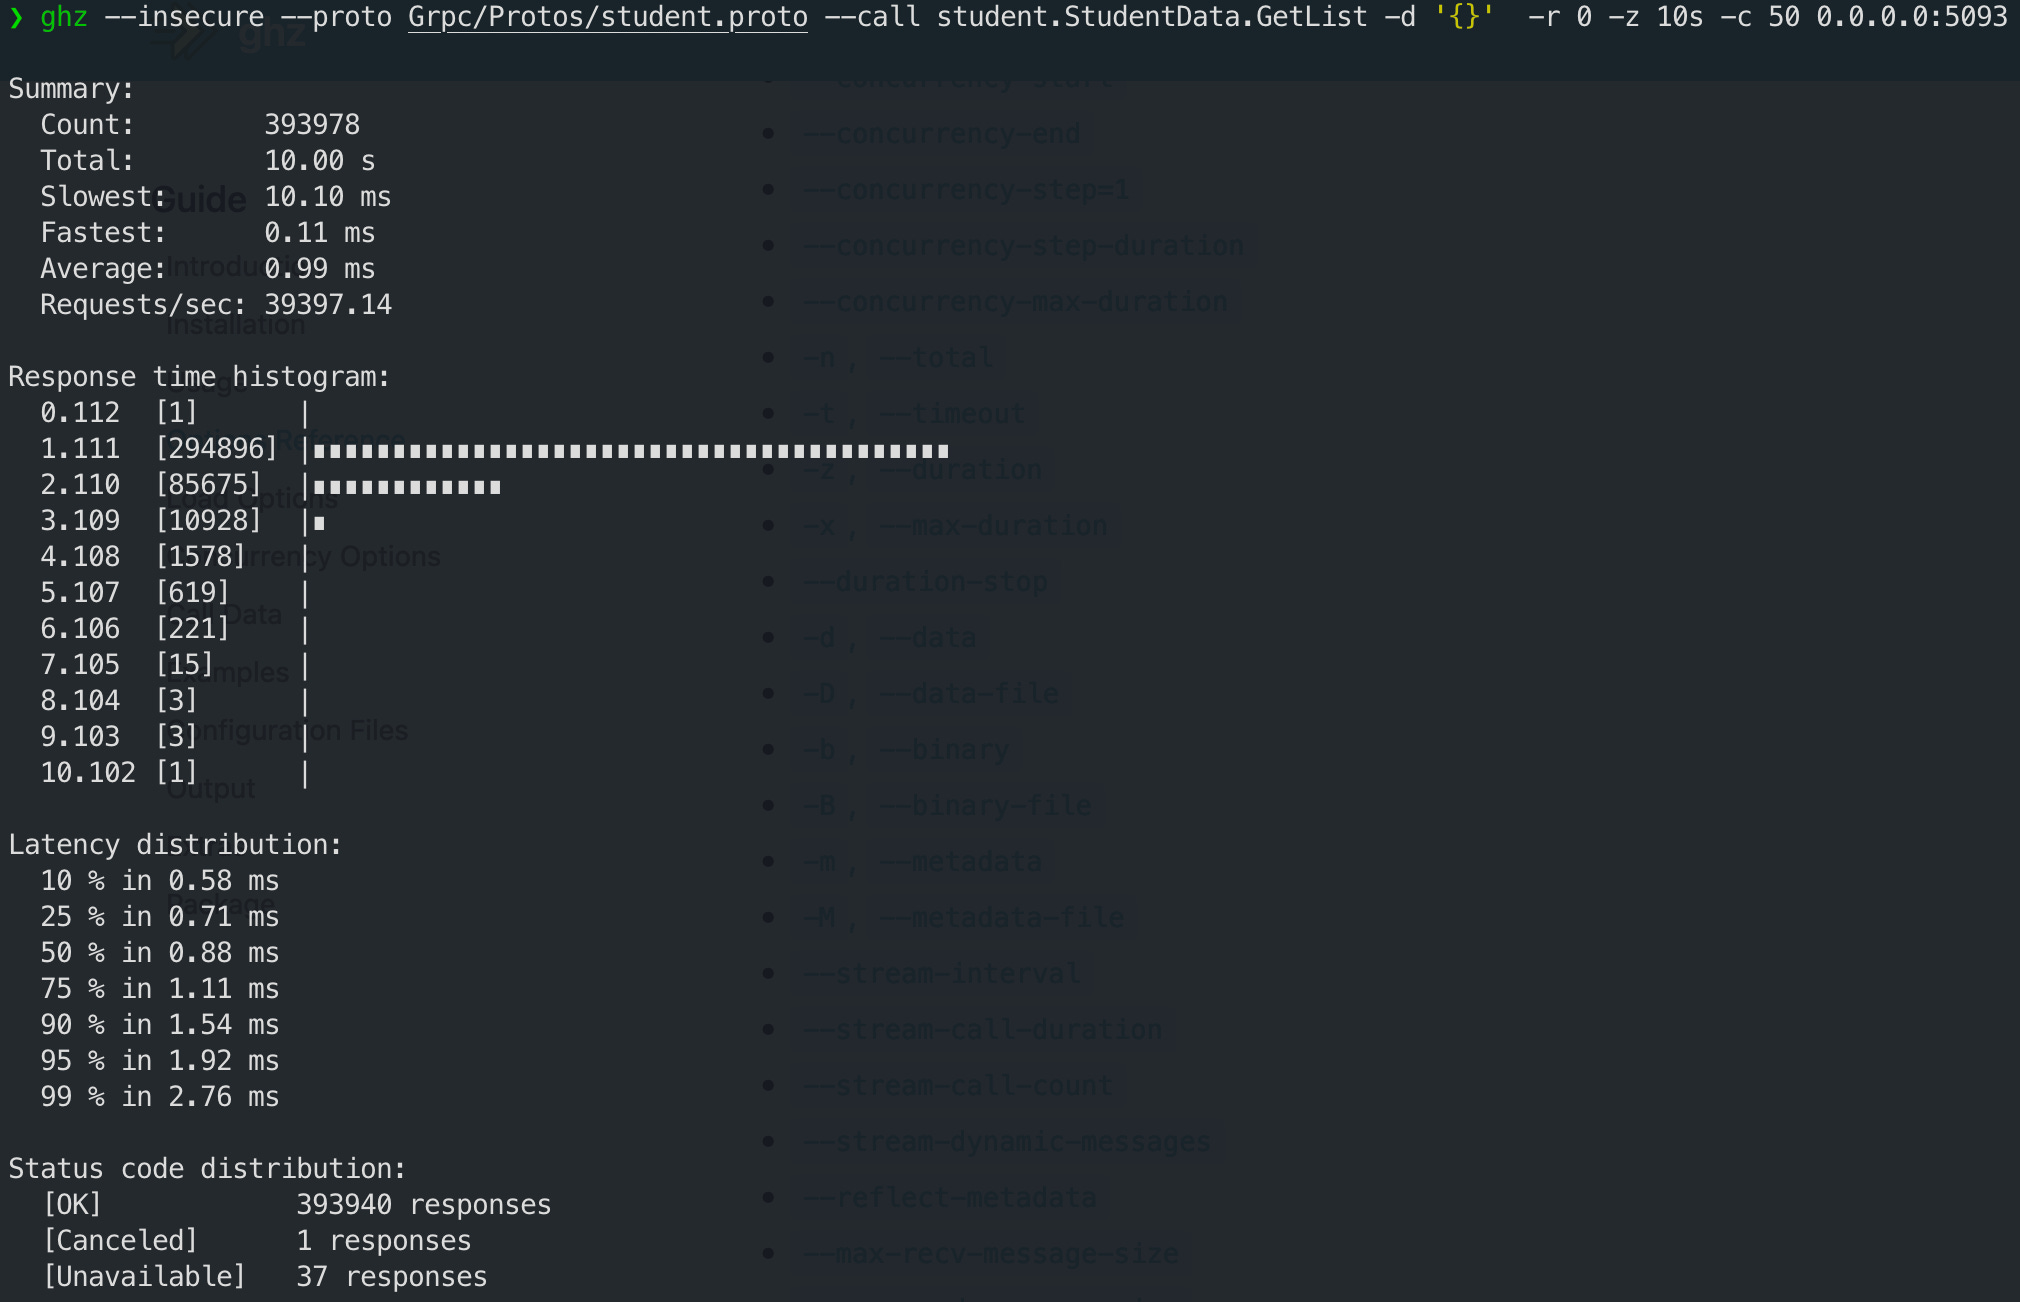
abandghzare written in different language. At a glance, you might not think much of this. But, I might be able to convince you at the end that implementation of the tool matters a lot.ghzonly opened 2 connections for the 50 concurrent requests. This does not seem realistic, at least in my case, where multiple different services can make a connection and then drop it.
To quickly check the 3) above, I re-ran the test with ghz and set the connection to be 50. The throughput dropped to ~34k rps, which is quite significant.
Both ab and ghz written in different language concern me a bit. I found locust which can load test against both. REST was supported out of the box and gRPC was not, but there were docs for it. While reading the docs, I found that there are two different http test implementations, the default and FastHttp. So, I ran all three variants, 1) default Http 2) gRPC and 3) FastHttp.

Run #1 was REST with default Http, ~3k rps and 100 open connections. Run #2 and #3 are gRPC, ~7.7k rps and 2 open connections. Run #4 was REST with FastHttp implementation, 13k rps and 100 open connections.
A couple of interesting observations:
All results are inferior to those produced from
ghzandab. A data point that shows, implementation can skew the result.FastHttpis far superior compared to the other twolocusttests. Another data point to support the implementation argument.
Maybe locust was slower because it was written in Python. So I went to look for other tools for REST that are written in Golang. I tried two different kinds, just to gather more data.
The first one is vegeta and here is the command and result:
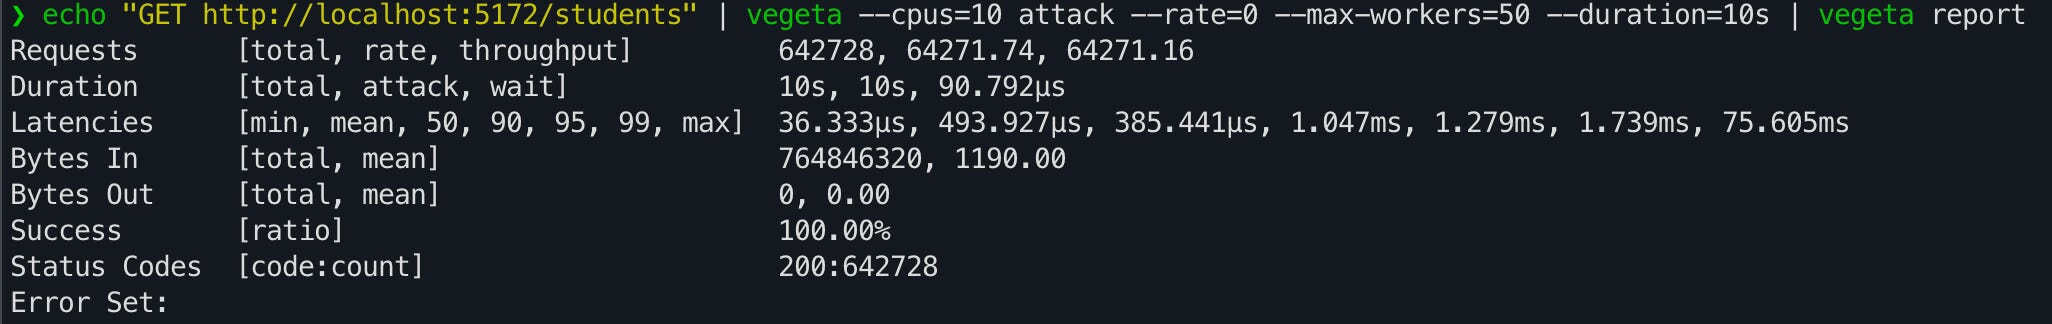
~64k rps
99th percentile at 1.74ms and 95th percentile at 1.28ms.
20 to 60 connections opened.
This blows the ghz and gRPC results out of the water. What gives?! I checked the result logs from vegeta, all showed 200 status code with the expected response data 😂
Ran another round with ali, also written in Golang and inspired by vegeta
~50k rps
99th percentile at 1.5ms and 95th percentile about 0.4ms
100 open connections
Although better than ghz and gRPC, but the rps was about 20% lower than vegeta. Same language, different results. ali does not have parameter for CPU, but I tried to keep the other settings the same.
At this point, I’ve stopped doing the load test and decided to inspect the request-response instead.
Size matters
gRPC claims to have smaller payload size, but how much different would it be compared to typical JSON from REST API?
For this, I used tcpdump to inspect the request and wireshark to analyze the result. First up is REST API.
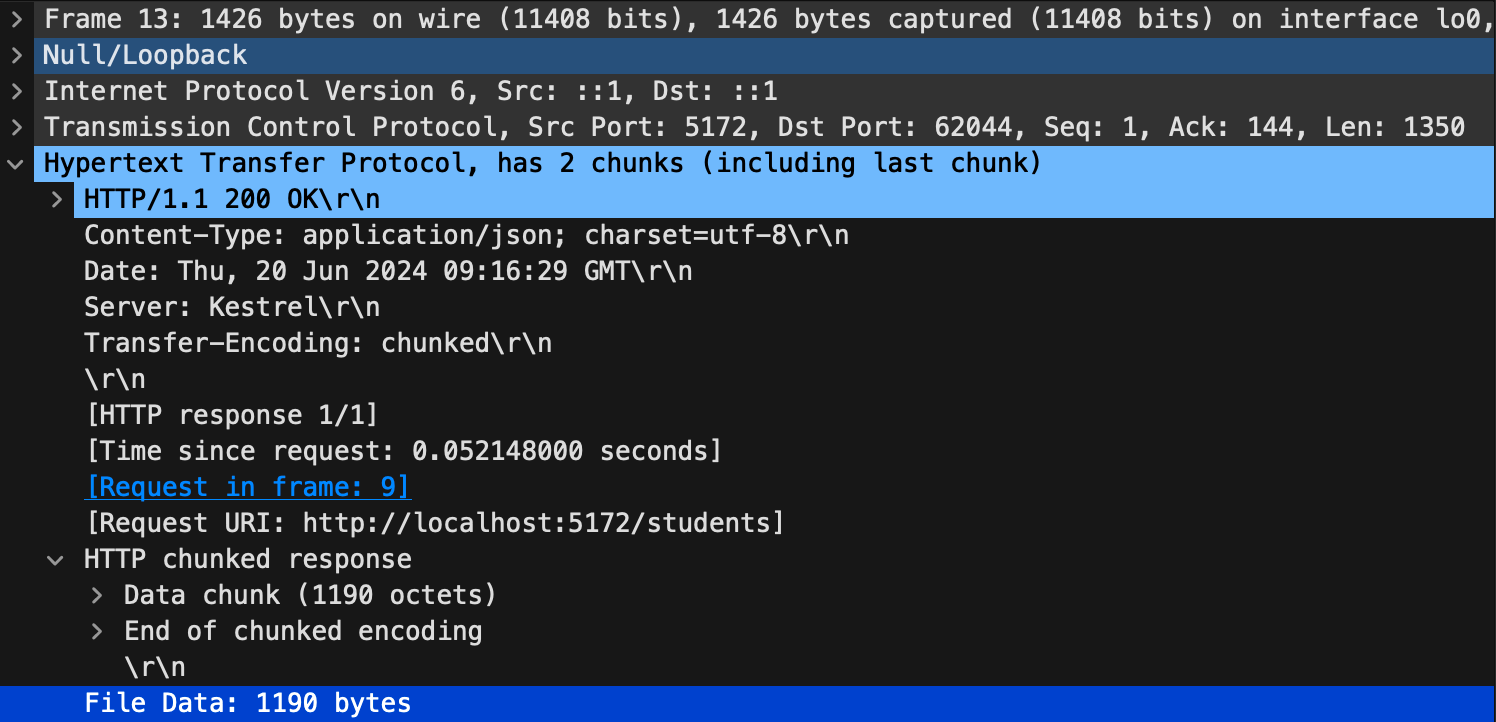
Without gzip, the request was 1493 bytes and the response was 1350 bytes and the JSON itself was 1190 bytes
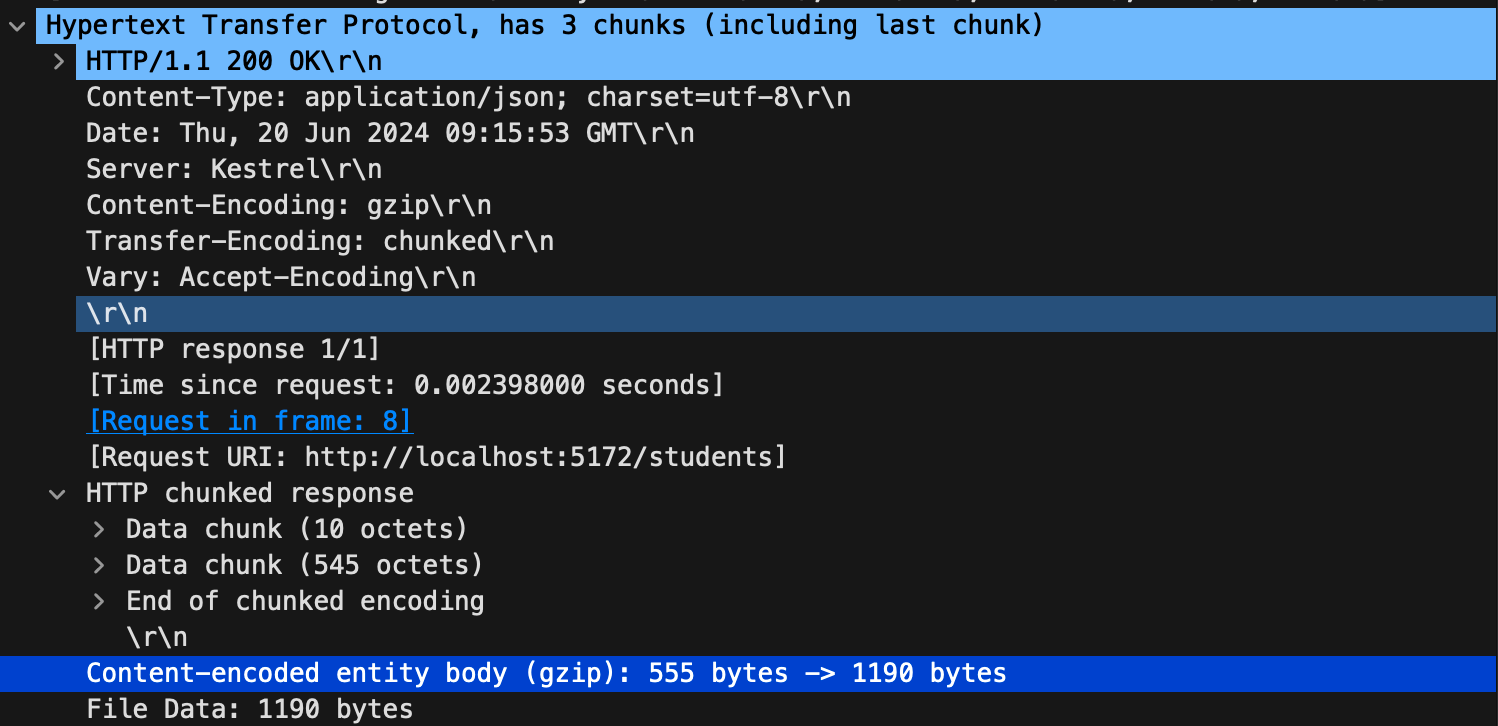
After compression was enabled, the entire request was 910 bytes, 767 bytes for the response and 555 bytes for the compressed JSON.
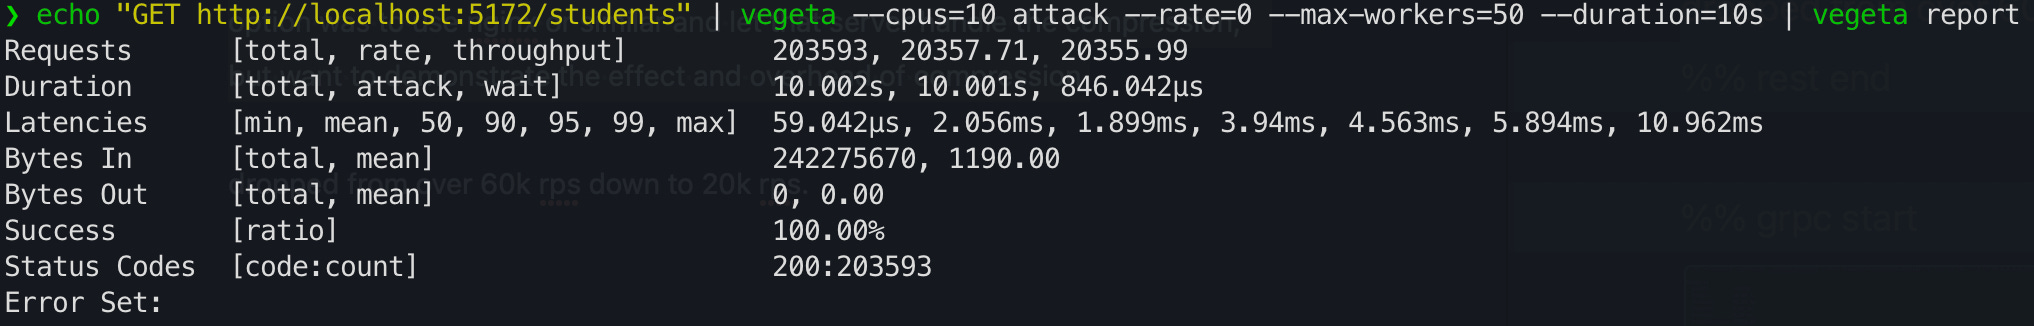
Out of curiosity, I re-ran the load test again with vegeta and the throughput dropped to ~20k rps. This was understandable because the compression was enabled in the code itself, which is documented to be not ideal. A better option would be to use Nginx or similar and let that server handle the compression. But, I wanted to demonstrate the effect and overhead of compression.
Let’s see how gRPC compares
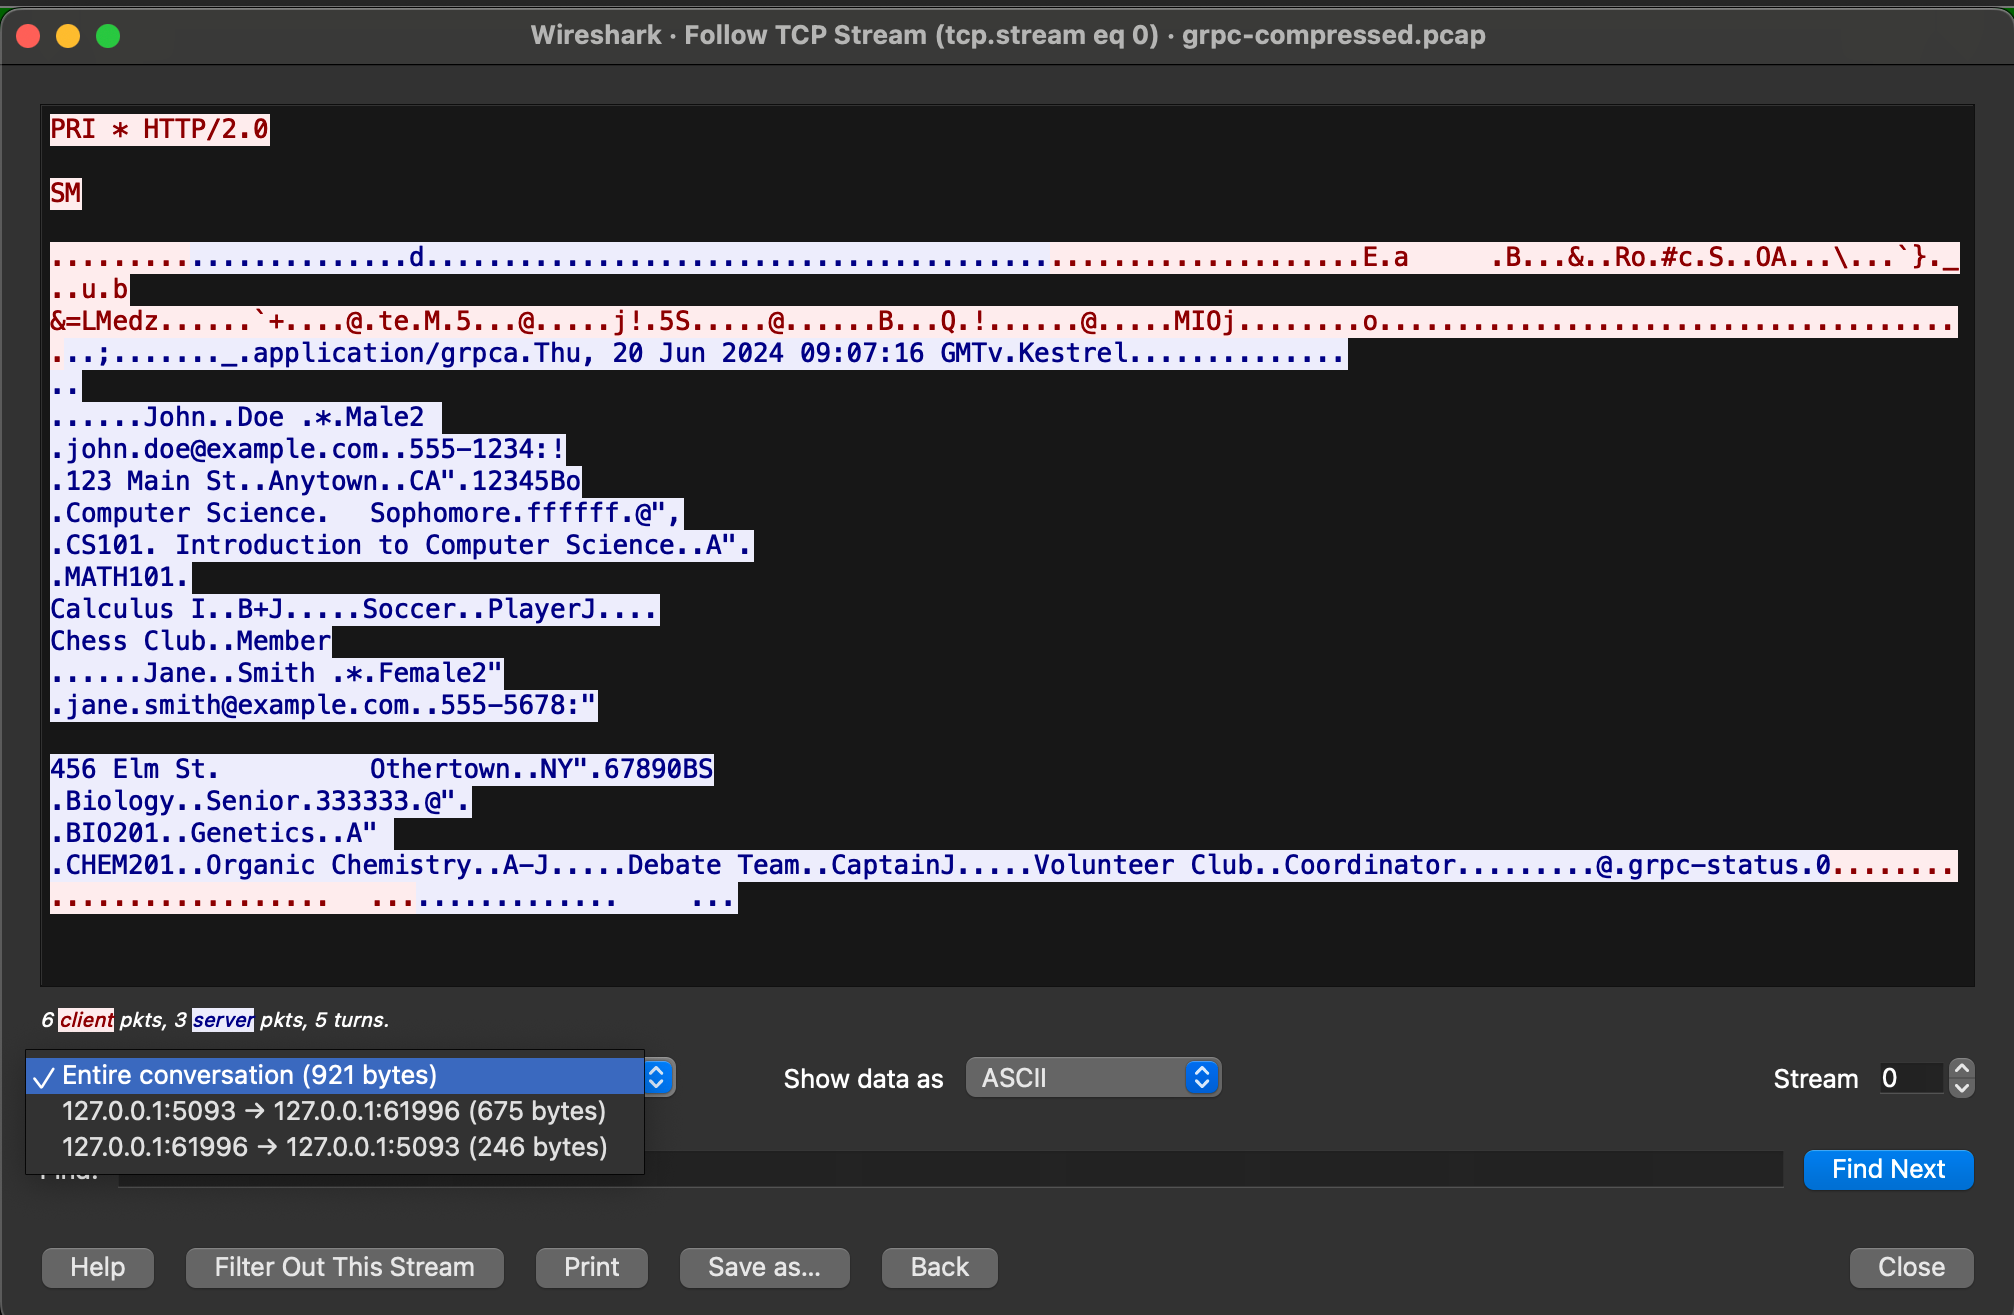
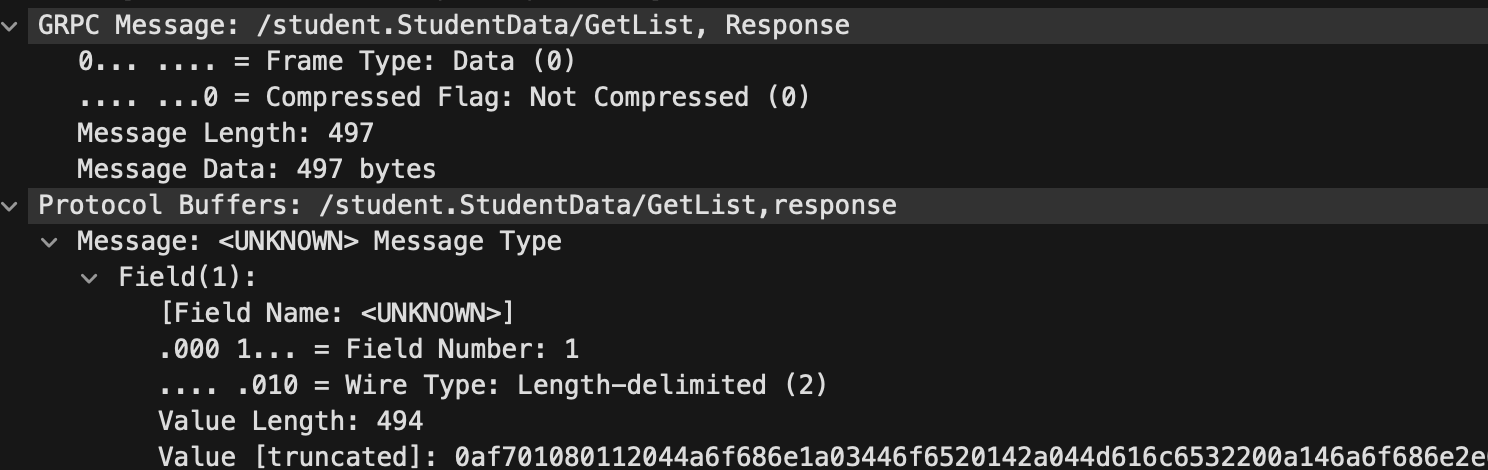
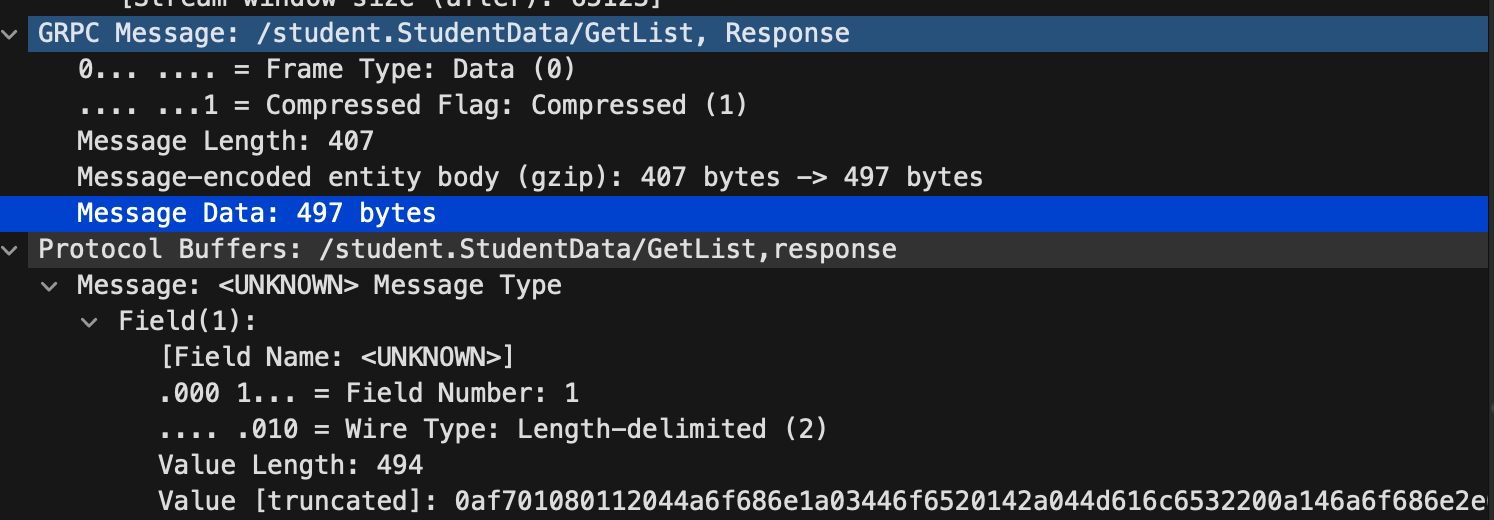
Without compression enabled in code, the entire request was 921 bytes and the response only was 675 bytes, smaller than the compressed REST variant. The data itself was 497 bytes.
When response compression was enabled in both server and client, the data size was reduced to 407 bytes. Not a big difference, which I suspect due to the small size of the payload.
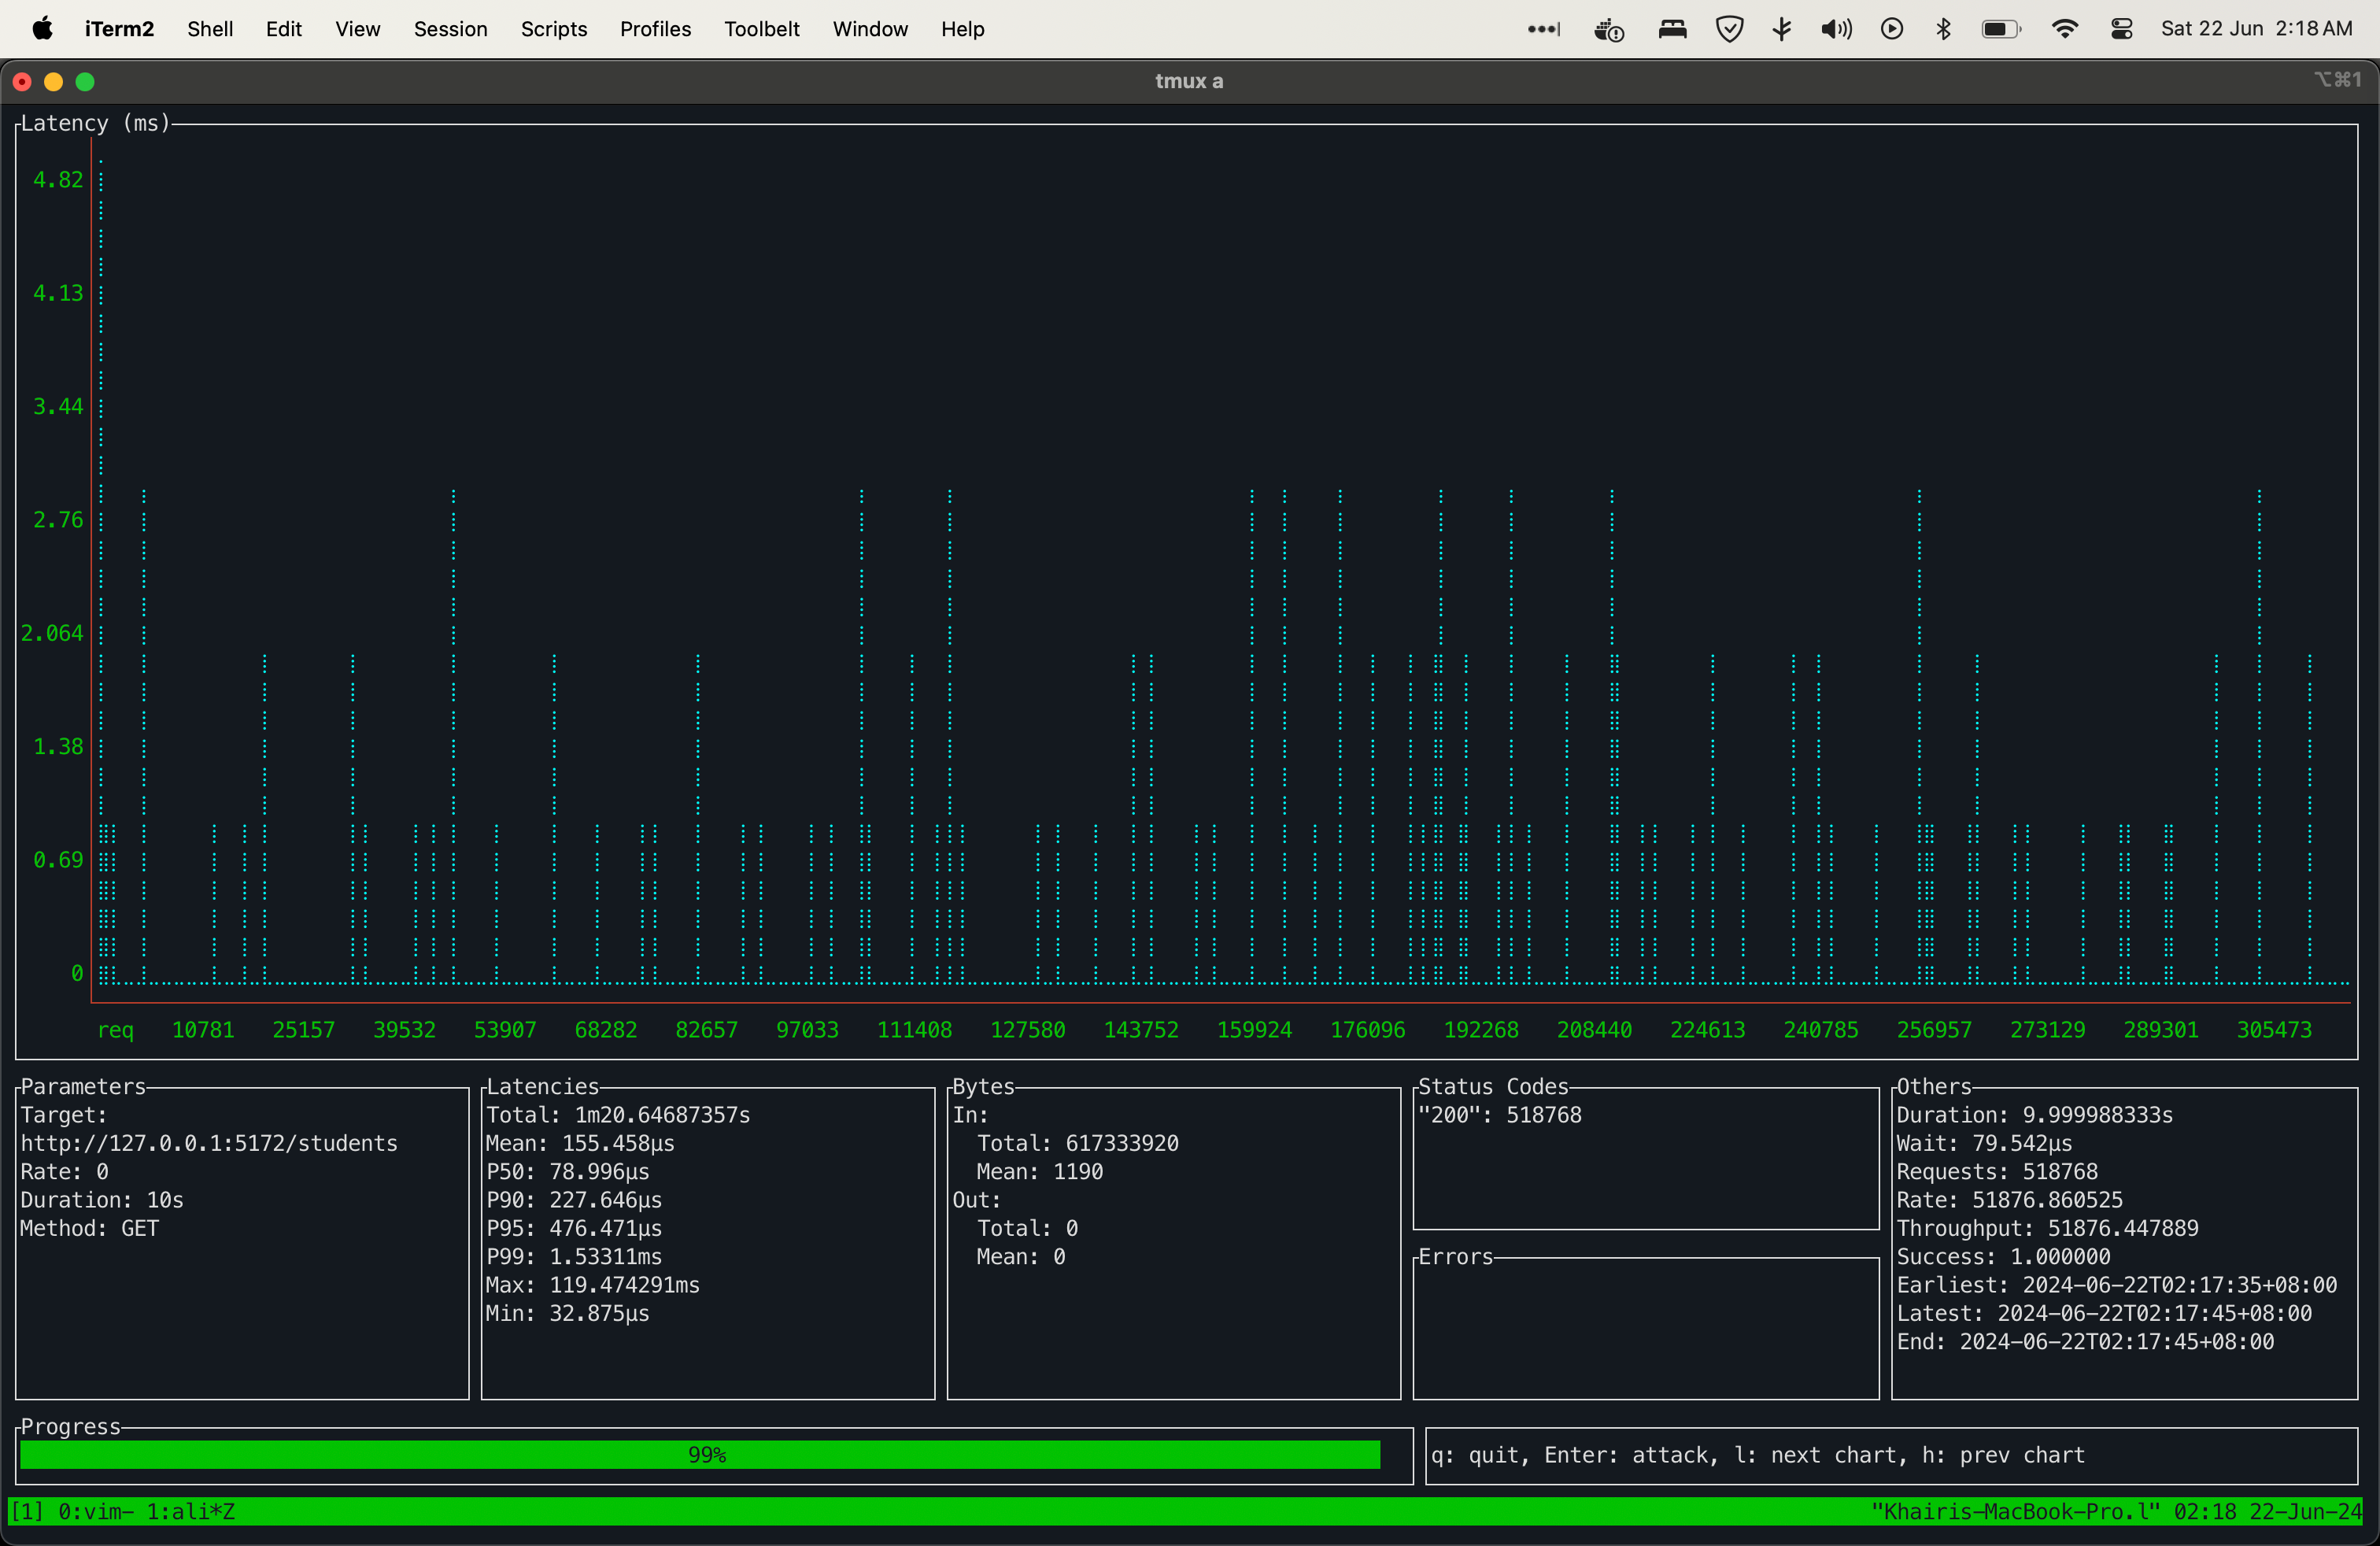
The throughput dropped to ~33k rps, as seen below.
But, that is not completely accurate. After inspecting the request from ghz, I noticed that ghz is sending the grpc-accept-encoding: gzip header regardless if the compression flag is enabled or not, and it is sending the header twice when I enable it via the -e flag.

After repeating the command again without the -e flag and the server has compression support, the throughput was up to ~39k rps. This makes me wonder, if reducing the compression header from 2 to 1 increased the throughput this much, would removing the header entirely help to improve it further? I can’t answer that until the issue is fixed in ghz.
Does any of this mean anything?
Let’s practice some arithmetics. For 100million requests per month, if your service is only active during business days, approximately 22 days instead of 30, and 8 hours per day. That comes about ~157 rps. But, we have to expect to handle spikes. How about 100 times of normal expected traffic? That is ~16k rps. Which both REST API and gRPC can handle quite well. In real service, there are other things that will slow things down, e.g.:
authentication
db access
cache access
I re-ran the load tests with ~16k rps.
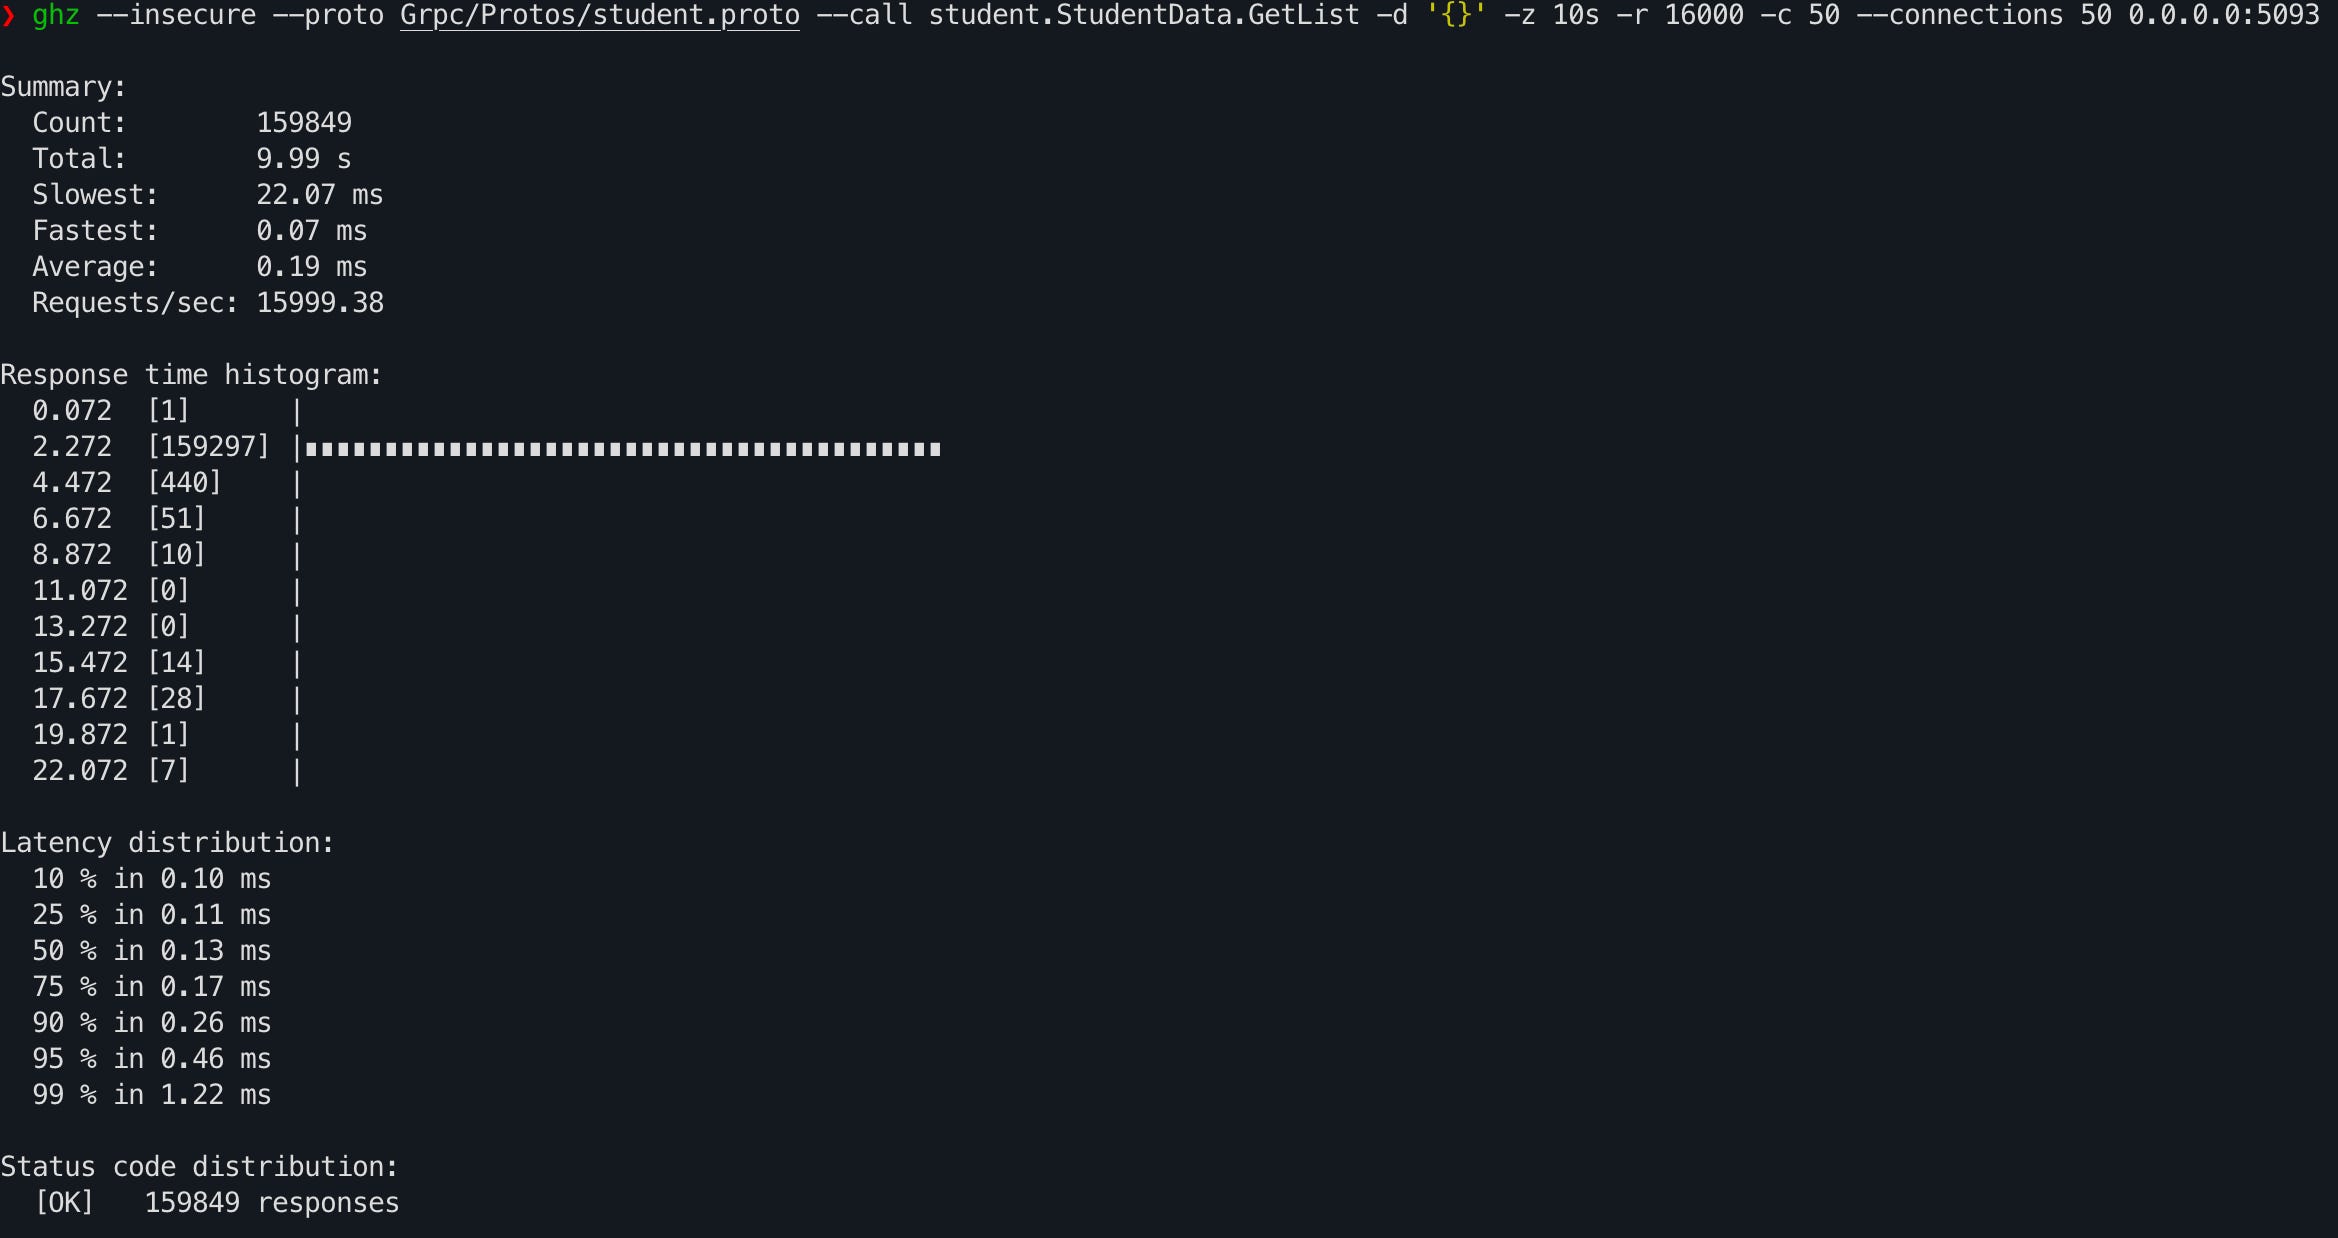
gRPC 99th percentile is ~1ms and the 95th percentile is ~0.4ms, again, it fluctuates.
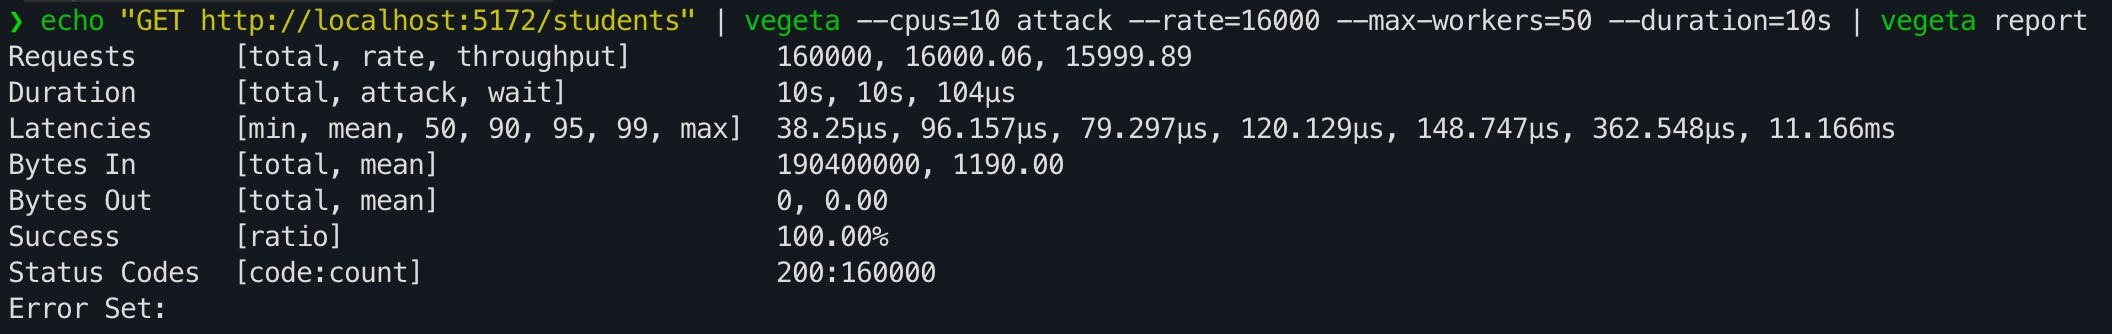
Using vegeta at 16k rps, REST API got 99th percentile response time less than half a millisecond.
Do these tests simulate real life scenarios? Most probably not. My takeaway from this is twofold.
First, don’t trust benchmarks because it is highly dependent on methodology, tools, and implementation.
Secondly, gRPC in C# provides than enough performance for my needs and I would highly consider doing a deeper real-world experiment with it if the need ever arises.